How to predict biodegradation risk and reservoir fluid quality
EXPLORATIONHow to predict biodegradation risk and reservoir fluid qualityA new approach, the biodegradation index, uses the thermal and hydrocarbon-charge histories of a prospect to allow quantitative, pre-drill risk assessment for biodegraded oilsZ. (Alan) Yu, G. Cole, G. Grubitz and F. Peel, BHPBilliton Petroleum, Houston
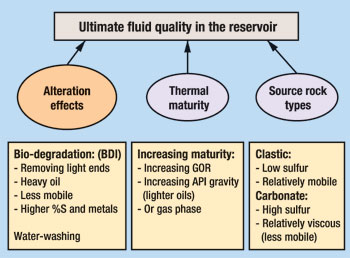
Recent advances in basin modeling define rock permeability and migration timing from source to reservoir, allowing BHPBilliton Petroleum to develop a new approach, Biodegradation Index (BDI), to predict biodegradation risk and fluid quality in reservoirs. It has been long recognized that temperature plays a key role in biodegradation, as most biodegraded oils occur at temperatures <80°C. However, most studies have not integrated the burial and charge histories of fields. Instead of using only the present-day temperature, which can be misleading and usually overestimates biodegradation, BDI considers the temperature history and residence time of hydrocarbons in the reservoir. An empirical relationship between BDI and API gravity was developed based on dozens of oil discoveries worldwide. Very encouraging results have shown that BDI can be used as a quantitative tool for the pre-drill assessment for biodegradation risk and reservoir fluid quality. This article defines BDI mathematically and illustrates its use in two deepwater GOM examples. Introduction Prediction of fluid quality has become increasingly important as exploration extends into ultra-deepwater areas, where drilling costs are high. In general, oil gravity and viscosity in reservoirs are influenced by three components: 1) source rock type, 2) thermal maturity, and 3) alteration, Fig. 1. Many publications have addressed source-rock types, their maturity and consequent impact on reservoir fluid quality.1,2,3 Oils biodegradation has been recognized as a key risk in deepwater exploration worldwide. But how much is known about biodegradation? Where, when and how does it occur?
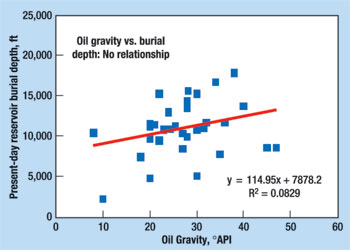
Traditional wisdom considers temperature as the main factor and has assigned a critical temperature for a bacterial-activity threshold, usually 65°C, although some papers have placed this as high as 70° – 80°C.4,5,6,7 In assessing biodegradation risk, usually only present-day reservoir temperature is considered, that is, whether it is under or above the critical limit of 65°C. Therefore, almost all, if not all, older papers regarding biodegradation have not addressed the timing of charge and the temperature conditions in which charge occurred. The authors will clearly show that biodegradation risk depends on not just its present temperature, but on the temperature history of oil charge since entering the reservoir. Observations of oil gravity from many field data sources show that:
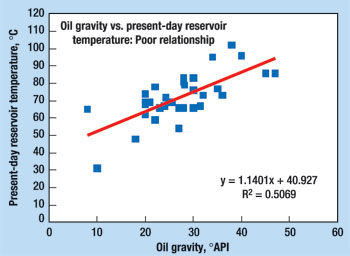
Oil gravity vs. present-day reservoir temperature is shown in Fig. 3 for the same samples in Fig. 2. This relationship is better than oil gravity vs. burial depth, but is still poor, with a correlation factor <0.5. Therefore, a better method is needed for predicting fluid quality, especially in deeper-water areas where economics play a crucial role on determining overall risk.
Three factors primarily control reservoir biodegradation: 1) paleo-temperature, 2) associated conditions under which a reservoir was filled, and 3) the residence time of oil in the reservoir. For example, an oil-charged reservoir at <50°C, charged over a long period of time, has a greater biodegradation risk than a reservoir that was rapidly charged recently, but still under 50°C. BDI Basin modeling has been widely used in exploration to reduce risk by assessing:
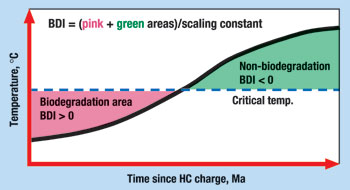
Recent advances in basin modeling have been used to define rock properties, charge timing and temperature history, and therefore, the resident time of hydrocarbons in the reservoir for fluid quality prediction.8,9,10,11,12 Since biodegradation risk is related to paleo-temperature and reservoir residence time, integrating the temperature relative to the critical temperature should provide a quantitative indication of biodegradation risk. Critical temperature is the temperature above which no bacterial activity occurs, in this case, 65°C. Fig. 4 shows a schematic of the BDI concept.
Numerically, the temperature history curve and hydrocarbon-charge rate can be defined as a discrete time series (1, 2, i, . . . , to N) with i=1 as the onset of filling and i=N as present day. The BDI function is defined as: where:
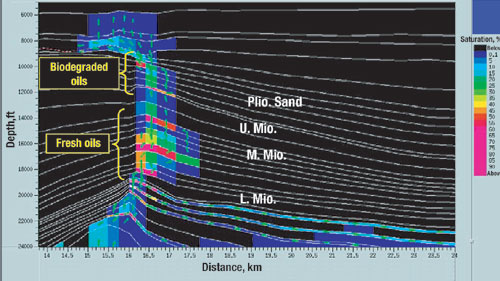
Critical temperature is a debatable parameter that needs further refinement. The 65°C value is normally considered a global upper limit for bacterial activity, but it can be lowered based on field data. The way that it was determined in this study is by the minimum mismatch for the calculated BDI and field oil-gravity data. A 63°C value is preliminarily based on the authors’ field database and is used in their BDI calculation. Field Examples Example 1. 2-D basin modeling has been used in the GOM deepwater area to study the petroleum charge in high-depositional-rate systems, mostly young sediments (Miocene and younger reservoirs) with a Jurassic source-rock. This deepwater basin has been in a highly transient state in terms of thermal regime and fluid flow / compaction, which results in highly over-pressured and low-temperature environments. Recent drilling successes (Mars, Maddog, Thunderhorse, etc.) have proven its enormous hydrocarbon potential. However, one of the key risks is the fluid quality due to biodegradation. Both fresh / unaltered and severely biodegraded oils have been discovered in deepwater areas. Fig. 5 is a cross-section showing the modeled hydrocarbon saturation (high in sand reservoirs) from a deepwater GOM area with stacked Miocene and Pliocene reservoirs. Modeling results indicate that the hydrocarbon charge was expelled from a primary Tithonian marl source between 8 – 15 million years ago, and the oils migrated into the reservoirs at much later times.
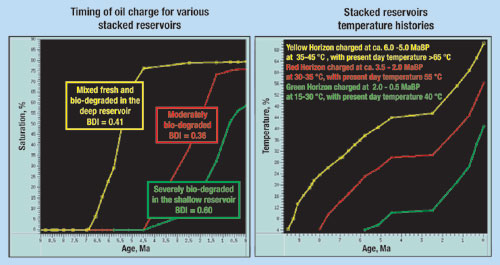
In this example, the deeper reservoirs are charged early and at relatively high temperatures, whereas the shallowest reservoir is charged within the last 2 Ma, but at very low temperatures. Fig. 6 shows the modeled charge timing and reservoir temperature histories for the stacked Pliocene and Miocene reservoirs. Notice that in this case, biodegradation is more severe at shallow depths than at deeper sand levels, as is indicated by the calculated BDI value. However, the BDI value does not have to directly decrease with burial depth. That is, BDI could be higher (higher risk) at deeper reservoir levels than at shallow levels depending on charge timing, as shown in the following example.
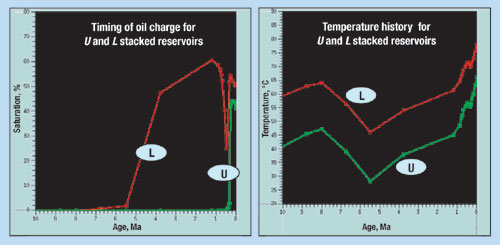
Example 2. Fig. 7 shows the reservoir temperature and charge history from another deepwater GOM field. There are two main reservoirs, "U" and "L", in this field, with present day temperatures at about 65° and 75°C, respectively. The U sand contained no biodegraded or high-gravity oil, while the L sand contained moderately biodegraded oil with low gravity. It is believed that all the oils were charged from the same sources based on geochemical characteristics. So, why does the deeper and hotter sand (at present day) contain poor fluid quality compared to the better-quality oil in the shallower sand with lower temperatures? The key difference relates to the charge and temperature histories and reservoir-residence times at the critical temperature for biodegradation.
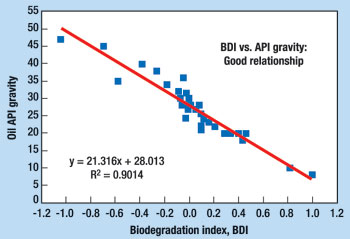
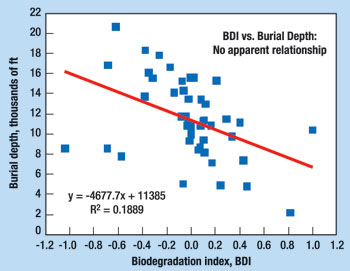
The L sand was charged early (about 5 Ma ago) at a reservoir temperature of less than 48°C. This early oil was subjected to biodegradation temperatures for about 3.0 million years – a relatively long time – whereby the sand was buried deeper and reached the temperature above which no bacterial activity occurs. However, the U (or upper) sand was charged only about 0.5 Ma with the paleo-reservoir temperature at about 58°C (present-day temperature is 65°C). This oil shows almost no biodegradation. BDI values for the two reservoirs are 0.28 for the L sand and 0.04 for the U sand. The reason that the L sand has a higher risk compared to the U sand is due to residence time and temperature history. The better fluid quality predicted for the upper sand was later observed in the fluid data. Empirical Relationship Over two-dozen oil fields have been studied using a consistent basin-modeling method and calibrated to local thermal and rock-property data. Fluid data, charge timing and temperature histories from 2-D fluid flow models have been fully integrated. As demonstrated above (Figs. 2 and 3), oil gravity vs. burial depth and oil gravity vs. present-day reservoir temperature have shown no – or at best, poor – correlation. However, calculated BDI values vs. API-oil gravity for these fields show a very strong correlation (coefficient >0.9), Fig. 8. Thus, the BDI method can be used as a pre-drill indicator to predict fluid quality and biodegradation risk.
Figs. 9 and 10 also demonstrate the advantage of the BDI method. The BDI value is not linearly related to burial depth or present-day reservoir temperature, but is related to the paleo-temperature and residence time of hydrocarbons in the reservoir, and this is reflected within the calculated BDI value. Therefore, the simple depth or temperature cut-off method for biodegradation is inappropriate as used in the past and can be more misleading than helpful in addressing the biodegradation risk.
To assess biodegradation risk in the process of prospect evaluation, a preliminary five-level classification of the BDI value is presented below based on the authors’ current worldwide database:
Fig. 11 provides typical temperature profiles for different charge histories, their respective biodegradation risks and potential oil quality. Comparing Type II and Type III, although they have somewhat similar temperature ranges, different oils are expected due to different charge time. Type III should have better oil quality than Type II due to residence-time differences. Comparing Types I and IV, when both are charged early, low temperature is more critical for fluid quality and biodegradation risk.
Discussion Biodegradation is a complex issue that depends on the progressive history of oil flow into a reservoir and the temperature history since its arrival, as well as other factors. Initially, a more complex calculation was considered that took all of these factors into account. However, the simplified approach described here gives a very good fit of calculated BDI to oil quality. Therefore, the authors propose that the simple BDI calculation is a valuable tool, while recognizing that it is an approximation which does not use all the variables and kinematic complexities existing in nature. Fluid-quality indicator. BDI can be used as the biodegradation risk indicator for any basin and its burial history. However, as a fluid-quality indicator, BDI is more approximately accurate when the reservoir is charged recently and uniformly. The empirical relationship established here is largely based on data from young basins worldwide with relatively recent charge histories. For older basins, the time integral error bar for BDI value is expected to be larger and, therefore, the normalization and scaling factor is justified by fitting the well-fluid data in the BDI calculation. Source type. As pointed out in Fig. 1, fluid quality is also related to source-rock types, e.g. either clastic or marls / carbonates. Generally, clastic source rocks produce sweeter oils (less sulfur) than marls and carbonates. The database the authors selected and calibrated in this study is mainly from marine Type II marl source rock. For a true clastic source rock, a correction factor for the BDI/oil-gravity relationship might be necessary. Sources of uncertainty. To obtain the correct charge timing and reservoir paleo-temperatures, it is essential to use a consistent and correct thermal model and the correct dynamic parameters in 2-D or 3-D modeling. The charge timing and reservoir-temperature history determined from modeling could have a large range due to the approach / philosophy applied in the modeling. The geological constraints in the model, the available calibration data and its quality, and even the modeling software used can influence results. Two main sources of uncertainty are obvious: the thermal model and rock properties, and these will directly impact reservoir temperature and charge timing; therefore, the results will affect the calculated BDI value. For the modeling results presented here, a global conduction and convection transient-state thermal model, with the bottom thermal boundary selected at the deep thermal basement, rather than at the base of sediments was used.11,13 Selecting boundary conditions is very important in the modeling, since it will impact the source timing as in GOM cases. For migration modeling, the philosophy of a "simplified" geological model and oil-favored shale – relative permeability parameters – was used. "Open" faults were not invoked to enhance migration, because the authors believe the general migration trend is determined by the basin structure and not by user-controlled faults, despite the fact that faults could have significant impact on hydrocarbon distribution locally. Shale permeability is also important and should be locally calibrated using formation pressure data and any direct measurements. Multiple charge phases. Reservoirs can be charged by multiple phases (or through continuous charge), and this will complicate fluid-quality distribution. As has occurred in many GOM fields, the same reservoir level (or its vicinity) can contain both biodegraded and fresh oils, usually with the best reservoir sands filled with altered oil and poor reservoir sands with relatively fresher oil. This is a typical filling / charge result where the first oil charge is within the better quality reservoir when the temperature is low and the oil is subjected to biodegradation. The later oil (or continuing charge) charges the rest of the reservoir (poorer quality sands) when the reservoir temperature is higher. The result is fresher – and less biodegraded – oils within the same reservoir interval. Conclusions Biodegraded oil occurs at a large depth and temperature range with no apparent relationship between oil API gravity, reservoir burial depth and present-day reservoir temperature. Reservoir temperature history and the oil temperature during charging are the most important factors for determining biodegradation risk. Oil residence time is a key and critical factor for how severe oil will be biodegraded due to the time available for bacterial activity. The Biodegradation Index (BDI) proposed in this article shows that paleo-temperature and residence time has a very strong correlation with oil gravity, and therefore, can be used for pre-drill prediction of biodegradation risk and oil quality in exploration. Best modeling practices and controls are essential to ensure correctness of the derived BDI value. Vigorous and consistent modeling methodology and philosophy are encouraged. Finally, further study is needed to establish a broader database to allow for more source types and origins in fluid-quality prediction. Acknowledgment The authors thank BHPBilliton Petroleum for their support and permission to publish this article. References 1 Horstad, I., S. Larter and N. Mills, "A quantitative model of biological petroleum degradation within the Brent Group reservoir in the Gullfaks field, Norwegian North Sea," Organic Geochemistry, Vol. 19, Nos. 1 – 3, pp. 107 – 117, 1992. 2 Blanc P. and J. Connan, "Preservation, degradation, and destruction of trapped oil in the petroleum system – from source to trap," L. B. Magoon and W. G. Dow, Eds., AAPG Memoir 60, pp. 237 – 247, 1994. 3 Kornacki A. and K. Nelson, "Assessing the mix and the quality of crude oil and natural gas in the deepwater Gulf of Mexico," AAPG Hedberg Research Conference on Integration of Geologic Models for understanding Risk in the Gulf of Mexico, Galveston, Texas (abstract), September 20 – 24, 1998. 4 Shi Ji-Yang, et al., "A biological marker investigation of petroleum and shales from the Shengli oilfield, the People’s Republic of China," Chemical Geology, Vol. 35, pp. 1 – 31, 1982. 5 Clayton, C., "Source volumetrics of biogenic gas accumulation," in Bacterial Gas, R. Vially Ed., Editions Technip, Paris, pp. 191 – 204, 1992. 6 Peters, K. E. and J. M. Moldowan, "The biomarker guide – interpreting molecular fossils in petroleum and ancient sediments," Prentice Hall, Englewood Cliffs, NY, 1993. 7 Peters, K. E., J .M. Moldowan, M. A. McCaffrey and F. J. Fago, "Selective biodegradation of extended hopanes to 25-norhopanes in petroleum reservoirs: Insights from molecular mechanics," Organic Geochemistry, Vol. 24, No. 8/9, pp. 765 – 783, 1996. 8 Yu, Z. and I. Lerche, "Modeling abnormal pressure development in sandstone / shale basins," Marine and Petroleum Geology, Vol. 13, No. 2, pp. 179 – 193, 1996. 9 Yu, Z. and G. Cole, "Application of 2D basin modeling for pre-drill pore pressure prediction in the Gulf of Mexico and offshore West Africa," AAPG Hedberg Conference on Advances in Basin Modeling, Colorado Springs, CO (abstract), 1999. 10 Yu, Z., G. Cole, G. Grubitz and F. Peel, "Bio-degradation Index (BDI): A new approach to predict bio-degradation risk and reservoir fluid quality based on the basin’s thermal and hydrocarbon charge histories," AAPG Annual Convention, Denver, CO (abstract), 2001. 11 Pepper, A. and Z. Yu, "Influence of an inclined salt sheet on petroleum emplacement in the Pompano field area, offshore Gulf of Mexico basin," in Salt, Sediment and Hydrocarbons, C. Travis ET., Ed., GCSSEPM Foundation 16th Annual Research Conference, pp. 197 – 205, 1996. 12 Cole, G.A., Z. (Alan) Yu and R. Requejo, "Using 2D thermal modeling to predict fluid quality in deepwater exploration areas," AAPG Hedberg Conference on Advances in Basin Modeling, Colorado Springs, CO (abstract), 1999. 13 Ungerer et al., "Basin evaluation by integrated two dimensional modeling of heat transfer, fluid flow, hydrocarbon generation, and migration," AAPG Bulletin, Vol. 74, No. 3, pp. 309 – 355. 1990.
|
||||||||||||||||||||||||||||||||||||||||||||||||||||||||


- Prices and governmental policies combine to stymie Canadian upstream growth (February 2024)
- U.S. producing gas wells increase despite low prices (February 2024)
- U.S. drilling: More of the same expected (February 2024)
- U.S. oil and natural gas production hits record highs (February 2024)
- Quantum computing and subsurface prediction (January 2024)
- U.S. upstream muddles along, with an eye toward 2024 (September 2023)

