49th annual Schlumberger Reed-Hycalog rig census
DRILLING TECHNOLOGY49th annual rig censusSchlumberger Reed-Hycalog reports utilization jumps to 20-year highDavid Farmer, World Marketing Manager, Schlumberger, Drilling & Measurements, Houston
Statistical Highlights Key statistics from the census include the following:
Rig Additions – Rig Building Nearly Triples Over the past year, commodity prices have increased profitability, and the drilling industry has been mobilizing additional rigs to meet the growing need for units. The U.S. fleet gained 182 rigs in 2001, enough to offset reductions to the fleet and provide a net increase of 86 units. This compares to last year’s rig additions of 74 units, which did not offset fleet reductions. Fleet additions fall into one of four categories, Table 1:
Units assembled from components numbered 105 this year, up from 34 last year. This is the largest number seen in recent years and indicates that the supply of rigs previously deleted from the census was not exhausted by cannibalization. As market conditions warranted, owners were able to assemble needed rigs fairly quickly, despite the age of the fleet. The number of rigs brought back into service more than doubled in this year’s census. Fifty-six rigs were reactivated, versus 22 in 2000. Each of these rigs had been counted in previous census tabulations, but was subsequently removed due to becoming inactive or inoperable. Twelve rigs were brought into the U.S. during the 2001 census, the same number as last year. Three units came from Canada, two from Venezuela and one each from Mexico, Singapore and the UAE. Four came from unknown locations. Movement out of the U.S. is covered in a following section. Nine newly manufactured rigs were added to the fleet this year, most as a result of plans made before natural gas prices started climbing. Owners reported building six new land rigs and three new offshore units. Rig Deletions – The Aging Fleet Continues To Dwindle Attrition continued to affect an aging fleet despite market conditions that called for expansion. It was expected that fleet reductions would decrease somewhat over the past year, and the overall available rig count would have climbed even higher than it did in 2001. However, 96 rigs were deleted from the U.S. fleet this year, 14 more than last year. Reductions were reported in five categories, Table 1:
Because census rules exclude rigs from the available count that require significant capital expenditures, 36 units were removed from the census once these limits were reached. This was similar to last year’s 40 rigs in this category. Rig owners were also asked if they had capital improvements planned for the next 12 months for each rig they owned. It was reported that during the coming year, 14% of available units are scheduled for refurbishment or upgrades. The number of rigs deleted from the census because they were stacked for more than three years was up to 28 this year. This compares to just 12 last year. These 28 (out of the 72 rigs stacked more than two years in last year’s census) were removed from the census because of inactivity, while the rest (44) were reactivated. Although this is quite a large increase in actual number of deletions in this category, the percentage of rigs reactivated after being stacked two years was fairly high, 61% versus 42% last year. The number of rigs auctioned for parts or cannibalized to support other units was essentially the same as last year. Twenty-three units were scrapped over the past year, versus 24 in 2000. Many of the rigs cannibalized in prior years are being resurrected in this year’s census as rigs assembled from components. Rigs typically move into and out of the U.S., and are tracked in the census each year. Six rigs moved out of the U.S. this year, versus four last year, with two moving to Canada, one to Brazil, one to Russia and two to undisclosed locations. Considering that six rigs moved out of the U.S. this year, while 12 moved in, there was a net increase of six units resulting from rig moves. Rigs destroyed during the past year comprise another category for deletions. Owners reported three units as sustaining irreparable fire damage from blowouts. Total rig additions numbered 182, while deletions totaled 96. Therefore, the net change in the rig fleet this year was a significant 86-unit increase, compared to the past few years, Fig. 3.
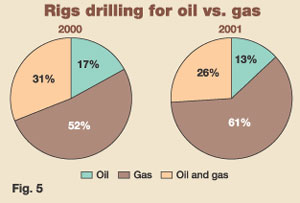
Drilling Activity Escalates A year ago, it was anticipated that drilling activity would rise modestly in the coming year, with no indication of the sharp upturn that gas prices would take. Census statistics for 2001 reveal a sizable increase in drilling activity, fueled by the gas market, driving activity up by over 30%. The 2001 active count was 1,593, up from 1,215, in 2000 and from 860 in 1999. This shows the count nearly doubling in just two years. The methodology used to count active rigs for the census is different from other active weekly rig counts that record units drilling during a single day. The census counts a rig as active if it has "turned to the right" any time during a defined 45-day period (this year’s period was between May 5 and June 18). Therefore, the Schlumberger Reed-Hycalog statistic always will be higher than other reported counts, because a longer time period is used to monitor rig activity. Every census region reported more rigs working than a year ago, Table 2. Regional unit increases were as follows: Gulf Coast (+85), Mid-Continent (+71), Permian basin (+51), Southeast states (+50), Southern Rockies (+47), ArkLaTex (+42), Northeast states (+11), California (+10), Alaska (+7) and Northern Rockies (+5).
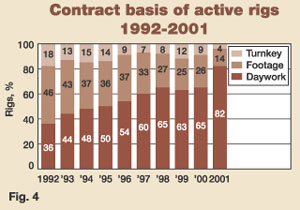
The 129 available rigs that were not drilling during the census period were classified according to the length of time they have been idle. Rigs stacked less than one year numbered 70; one to two years, 20; and two to three years, 39. Aging rules of the census state that any rig stacked for longer than three years will be removed from the available fleet. Adding the 70 rigs stacked less than one year to the 1,593 active units in the census provides the total number of rigs that drilled sometime during the past year. The full-year utilization figure indicates that 1,663 out of 1,722, or about 97% of available rigs, were put to work by rig owners over the past year, as compared to 85% in last year’s census. In addition, contractors tell us that 72% of their stacked rigs have a greater than 50% chance of going back to work in the next twelve months and that they are bidding jobs with all but 3% of the available fleet. Types of contracts covering the active rig fleet provide evidence of a market that was advantageous to drilling contractors. This year, daywork contracts rose to 82% of all contracts, as commodity prices climbed and spending budgets followed suit. Last year, daywork made up 65% of all contracts. Footage contracts are down to 14% from 26%, while turnkey contracts make up about 4%, compared to 9% last year, Fig. 4.
Other information that was gathered on the last well drilled by each active rig includes the following:
Rig Utilization Rebounds As one indicator of industry health, rig utilization, the ratio of active-to-available rigs, measures the supply-and-demand balance. Last year’s record 22 percentage-point increase in utilization was newsworthy. This year’s utilization shows further tightening, increasing another 19 percentage points to 93%. This puts utilization back to the level of the early 1980s and well above the historical average of 73%. Every U.S. region cited utilization increases for 2001. The Northern Rockies showed the greatest improvement, up 32 percentage points to 81%. Utilization figures for other regions were as follows: Mid-Continent, 98% (+25 percentage points); Permian basin, 97% (+23); Alaska, 48% (+23); Southeast states, 94% (+18); Gulf Coast, 98% (+16); Southern Rockies, 94% (+15); Northeast states, 85% (+11); ArkLaTex, 92% (+10); and California, 71% (+9). Examining land and offshore rigs separately, gross utilization was boosted to 93% for land rigs, up from 73% in 2000, Table 3, Fig. 6. The offshore utilization ratio has been stronger than the land ratio for the past several years, but this reverses in 2001. This year’s marine fleet utilization was up to 90%, up from 79%. According to the census, inland barge and floating rigs were in greatest demand. Utilization for both of these two types of rigs was 97%, Fig. 7. Bottom-supported rig utilization rose to 94% from 90%, while platform-rig utilization climbed 3 percentage points to 63%. It is also worth mentioning that rigs in every depth capacity showed utilization increases in 2001, Table 4.
The 93% overall gross utilization during the 2001 census period does not necessarily mean that rigs were working 93% of the time, because a rig drilling just one day during the 45-day census period would still be counted as utilized. However, rig owners were asked to estimate the number of days during the 45-day period their rigs were actually on jobs (moving days not counted). The average number of days each unit was utilized was 42 this year, up from 39 in 2000. Applying this factor to the 93% gross utilization rate gives an "on-the-job" utilization of 87%, significantly more than last year’s 64%. A "Contracting" Industry For more than a decade, mergers and acquisitions have been the norm in the drilling industry and this rate of consolidation has not begun to slow. The total number of rig owners counted in the census dropped another 17 companies this year, to 191, Fig. 8. In the past year, 340 rigs, or about 20% of the fleet, were affected by companies participating in mergers or acquisitions. These 340 units do not include rigs that were sold and subsequently scrapped for parts.
Contraction in the industry tends to place more units in the hands of larger rig owners. Companies that own 20 or more rigs now hold 62% of the total fleet, up 4 percentage points from last year, Fig. 9. The average rig owner now holds nine rigs in its fleet, up from eight last year. Just in the past five years, the number of rigs held by the "large" contractor group has more than doubled. Drilling contractors primarily remain the owners of most drilling rigs, owning 95% of all units, the same percentage as last year.
Contractors Expect Industry Stability A survey of U.S. contractors taken in conjunction with the rig census uncovers additional insight into the industry. Thirty-two contractors chose to participate in this year’s survey, representing about 17% of contractors and about 70% of the total rig fleet. Surveys were received from every region except Alaska and the Northeast states, with both large and small companies represented. For the twelve years that the contractor survey has been conducted, respondents have been asked to rank a set of issues by importance to their business. For the second year in a row, "crew availability" was the highest concern of contractors. The instability of the industry has left an acute shortage of qualified workers whose absence is magnified when commodity prices go up and contractors need to put additional rigs back to work. "Rig rates" remained second on the list of issues affecting contractors. "Availability of rig parts," "drill pipe replacement" and "aging of rig equipment," were ranked third, fourth and fifth, respectively. These issues have consistently been the top five concerns over the past few years, sometimes switching positions as industry conditions fluctuate. Ninety-four percent of contractors surveyed reported that their rig activity was up in 2001, the average being 23%. Almost all cited oil, and especially gas, prices as the reason for this increase. Contractors are hopeful that commodity prices will remain relatively stable during the coming year, with 59% optimistic that their rig activity will increase further. Every contractor responding to the survey reported higher rig rates compared with last year. According to survey data, land-rig rates in actual dollars averaged $11,172/day during the period May-June, 2001. In addition, land contractors were asked to estimate the change in land-rig day rates. Estimates revealed an average jump of almost 38%. Offshore rates averaged $42,682/day, and these contractors report that their rates have gone up about 28% since this time last year, although offshore data is not statistically significant due to sample size. Most contractors reported elevated expenses for maintenance and labor. Ninety-four percent plan to spend more on rig maintenance for 2001 than they did last year. On average, they expect maintenance costs to be up about 15% this year. This seems to climb annually as costs rise and the rig fleet continues to age. Across the board, contractors cited increases in crew labor rates as well, with an average increase of 20%. Due to the euphoria of the past year, many contractors now feel that the industry has somewhat stabilized and they are optimistic as long as product prices are sustained. When questioned about their plans for the next five years, contractors were generally confident, with more than 63% planning to expand current fleets, Table 5. Twenty-five percent have no plans for change. A significant number, 22%, are seeking merger opportunities. Nineteen percent are pursuing international opportunities and 3% are planning to diversify into other businesses.
Utilization Decline Predicted When gas prices were high, there were predictions of further gains in rig activity for 2002. Now that prices have retreated to more normal levels, companies may be reevaluating programs to reactivate and build more rigs and, subsequently, some projects may be delayed until prices rise again. If so, next year’s census will reflect this caution. Schlumberger Reed-Hycalog predicts that available rigs will rise a modest 3%, based primarily on the momentum of the past year and the optimism of contractors regarding long-term price stability. Activity, though, will probably experience a downturn. It is estimated that it could slow by 5% or so next year. If this occurs as predicted, the demand-supply ratio will suffer as utilization drops to about 85%. Although a significant decline from this year’s utilization level, it still shows a strength that has eluded the industry for most of the last two decades.
|
||||||||||||||||||||||||||||||||||||||||||||||||||||||||||||||||||||||||||||||||||||||||||||||||||||||||||||||||||||||||||||||||||||||||||||||||||||||||||||||||||||||||||||||||||||||||||||||||||||||||||||

- Applying ultra-deep LWD resistivity technology successfully in a SAGD operation (May 2019)
- Adoption of wireless intelligent completions advances (May 2019)
- Majors double down as takeaway crunch eases (April 2019)
- What’s new in well logging and formation evaluation (April 2019)
- Qualification of a 20,000-psi subsea BOP: A collaborative approach (February 2019)
- ConocoPhillips’ Greg Leveille sees rapid trajectory of technical advancement continuing (February 2019)

