Advances in MWD and formation evaluation for 2001
MWD/FORMATION EVALUATIONAdvances in MWD and formation evaluation for 2001Developments include new wireline, MWD, mud logging and testing toolsDavid Patrick Murphy, Shell Technology Exploration and Production, Houston
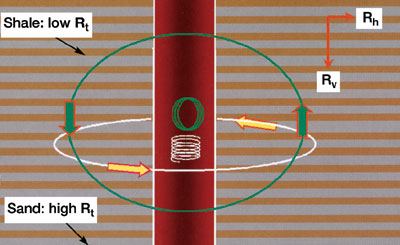
Wireline Logs Wireline logs typically provide more formation evaluation wellbore data for lower cost than other tools, except when rig costs are very high. Wireline jars, and open and cased-hole logs are discussed here. Wireline jars. Impact Selector Inc. has introduced multi-conductor wireline jars that can be used with wireline logs run by Baker Atlas, Halliburton or Schlumberger.1 This multi-stage, mechanical impact tool has a top spring assembly that stores energy as tension builds with a stuck logging tool. The spring releases when wireline tension reaches a pre-set value, jarring the wireline logging tool loose with multi-stage impacts. The pre-set tension can be set quickly or changed at the surface. Once the jar has tripped, it can be reset immediately by slacking off the wireline. 3D induction. Resistivity logs typically are used to obtain true formation resistivity (Rt) for determining water saturation. Induction tools are used in non-conductive or fresher water-based muds. Array devices provide multiple depths of investigation. The newest induction resistivity tool is a three-dimensional device that provides horizontal and vertical resistivity. Halliburton has developed a new High Resolution Array Induction (HRAI) logging tool.2 It will provide resistivity logs at six radial depths of investigation (10, 20, 30, 60, 90, and 120 in.) with 1-, 2-, and 4-ft vertical resolution. HRAI symmetrical tool design permits separation of the vertical processing and radial processing. As a result, each transmitter / receiver measurement can be filtered to a common vertical resolution prior to radial processing. Consequently, near-borehole effects caused by washouts, etc., are localized in shallow logs, with significantly reduced effects in deep logs. To identify, delineate and accurately quantify oil-in-place from low-resistivity, anisotropic reservoirs, the 3D Explorer Induction (3DEX) tool was designed and developed with collaboration between Baker Atlas and Shell Technology Exploration and Production.3 Baker Atlas’ 3DEX employs three mutually orthogonal transmitter / receiver coil arrays. Inversion processing of tool readings allows computation of horizontal and vertical resistivities, Fig. 1.
The availability of both horizontal and vertical resistivities allows determination of resistivity anisotropy like that caused by thinly laminated hydrocarbon-bearing sand-shale sequences. Conventional induction tools generate currents parallel to formation bedding layers in boreholes drilled perpendicular to the formation, measuring only horizontal resistivity. Many times, horizontal resistivity in thinly laminated hydrocarbon-bearing sand-shale layers can make the formation look water-bearing. Petrophysical evaluation of thinly laminated horizontal hydrocarbon-bearing sand-shale layers using the new vertical resistivity measurement provides improved oil-in-place estimates over those derived using horizontal resistivity. 3DEX is the most effective resistivity device able to locate and evaluate this type of low resistivity pay zone. Imaging logs. Two new developments allow high-resolution borehole wall resistivity imaging log data to be obtained in wells drilled with oil-base mud. New from Schlumberger, the Oil-Base MicroImager (OBMI) tool is a four-pad microresistivity imager engineered to provide borehole wall imaging in nonconductive diesel- or synthetic-based mud systems.4 OBMI acquires images with 0.4-in. (1-cm) nominal resolution and provides 32% circumferential coverage in an 8-in. borehole. The system was field tested in North America and West Africa throughout 2000, and is being introduced in selected areas. Successful applications include detailed structural and stratigraphic analysis, vertical compartmentalization analysis, thin bed detection and high-resolution net pay count. OBMI can be logged at conventional logging speeds of 3,600 fph. During field testing, OBMI’s combinability has been validated with a large number of Schlumberger’s wireline logging tools, including the Platform Express logging system. For circumstances where synthetic-based mud systems are required for drilling, but conventional while-drilling or wireline resistivity imaging logs are to be run, M-I has developed a conductive, invert-emulsion drilling fluid system called SigmaDril.5 The system’s proprietary, patented chemical package makes the continuous oil phase conductive without destabilizing the emulsion. The result is a drilling fluid system in which the borehole fluid, filter cake and mud filtrate provide a level of conductivity required for resistivity imaging logs normally run in a water-base drilling fluid. Cased hole resistivity. Two wireline tools provide formation resistivity information through casing. Cased-hole resistivity applications include openhole log replacement for cost savings, obtaining data if openhole logging was not possible, plus reservoir saturation monitoring.
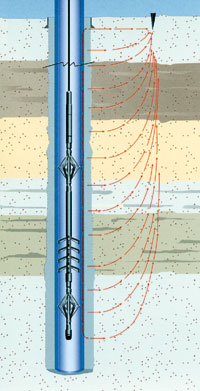
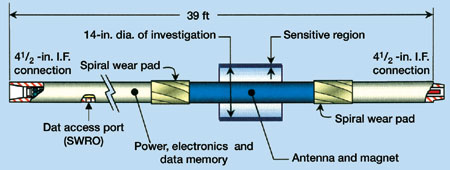
Schlumberger’s Cased Hole Formation Resistivity (CHFR) design incorporates four levels of three-voltage electrodes, spaced 120° apart, Fig. 2.6 This 12-electrode configuration allows fast operations and provides redundant measurements. Noise created by tool movement is four magnitudes higher than the measured signal, so the CHFR makes stationary measurements. The 2-min station time, which includes downhole calibration, is equivalent to 120 fph logging speed. Formation resistivities from 1 to 100 ohm-m can be measured with 10% accuracy. Longer station times improve accuracy and extend measured resistivity range. In cooperation with a consortium of oil companies led by Gas Research Institute, Baker Atlas has developed a Through Casing Resistivity (TCR) tool.7 Since it is desirable to lower the tool through small diameter tubing to a zone of interest where single casing is present, TCR is a hydraulically operated tool, 2.125 in. in diameter. The tool body is pressed against the casing wall, and seven electrodes are deployed to make electrical contact with the casing metal. TCR makes stationary measurements. Field tests showed that TCR readings are very close to openhole readings, up to 100 ohm-m. Baker Atlas found that the cement effect is usually small and can be corrected. Collars and other casing inhomogeneities are compensated. Crossed dipole sonic. In addition to determining acoustic compressional wave velocities, crossed dipole tools can be used to determine acoustic shear wave velocities and their orientation in the formation for evaluation of anisotropic formation stresses. Halliburton’s new WaveSonic provides simultaneous monopole and crossed dipole sonic information.8 The tool’s isolator design allows for drill-pipe-conveyed operations. It is combinable with all of Halliburton’s openhole tools and is not limited to bottom of the tool string. Slim C/O. Cased-hole carbon / oxygen (C/O) logs are spectral-pulsed neutron-capture (PNC) devices used to determine water saturation. C/O measurements for saturation work best in high porosity zones. PNC sigma measurements for saturation work best in high porosity zones containing high formation water salinity. These logs also can be used to detect water flow by oxygen activation. Halliburton has developed Reservoir Monitor Tool Elite (RMT Elite), a small diameter (maximum 2.125-in.) C/O and PNC tool.9 RMT Elite uses high-density bismuth germanium oxide detectors. Its modular design allows multiple operating modes, including simultaneous inelastic, capture and water flow measurements. Modular design also provides for adding production logging sensors. In addition to conventional C/O and PNC sigma interpretation models, Halliburton has developed customizable interpretation models for specific reservoir situations; for example, combining sigma and C/O measurements for determining oil and steam saturations in heavy oil steam floods. Baker Atlas has introduced a 1.7-in. Reservoir Performance Monitor (RPM) tool.10 Operating modes include pulsed neutron capture (PNC), pulsed neutron spectrometry (C/O), pulsed neutron holdup (PNHI) and neutron activation water flow measurements. Dynamic response generation and dual-detector optimized weighting are used to minimize the uncertainty in C/O saturation determination. Formation and borehole sigmas are corrected for diffusion and borehole salinity effects. MWD MWD formation evaluation tool suites now provide measurements similar to almost all available openhole wireline logging tools. MWD results can be available almost in real time. Nuclear magnetic resonance. Sperry-Sun and Numar have field tested an experimental Magnetic Resonance Imaging Log While Drilling (MRIL-WD) tool, Fig. 3.11 The hardware was designed to be compatible with the wireline Magnetic Resonance Imaging Log (MRIL) at the data processing and interpretation level. To render the measurement robust against drillstring motions, there are two main data acquisition modes:
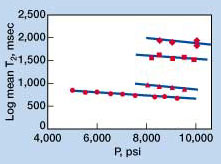
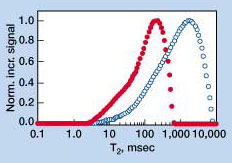
The next tool generation will include a connection to the downhole pulser system to transmit selected information up-hole. RL Porosity and RL Free Fluid are the most likely parameters to be available in real time. Switching modes between RL and EL will be triggered by elapsed time, by counting measurements or can be tied to outputs of accelerometers / magnetometers that can differentiate between drilling and non-drilling conditions. Pulsed-nuclear LWD. Schlumberger has field tested a pulsed-neutron logging while drilling tool.12 The experimental Porosity Evaluation Tool (xPET) is the result of a collaboration between the Japan National Oil Corp. and Schlumberger. It provides a suite of nuclear measurements that include neutron porosity, thermal neutron capture cross section (sigma), pulsed-neutron density, epithermal neutron slowing down time and relative abundance of certain elements (Ca, Si, Fe, S, etc.) that can be used for mineralogy calculations. The xPET real time azimuthal measurements can be useful for geosteering applications. Use of a pulsed-neutron source eliminates the need for radioactive chemical sources, source storage pits, transport shields, loading shields, collar shields and handling tools used with conventional nuclear MWD tools. Fluid Properties Log response depends on properties of rocks and their pore fluids. Accurate formation evaluation depends on having knowledge of in situ rock and fluid properties. NMR fluid response. Nuclear magnetic resonance (NMR) properties of an undersaturated oil have been measured over a range of temperatures and pressures, from ambient to reservoir conditions by Shell Technology Exploration and Production.13 The measurements found that dissolved gas has a strong impact on reservoir fluid NMR response, Fig. 5.
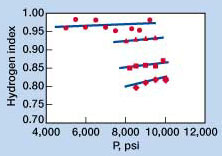
NMR relaxation times, T1 and T2, of live oil are about ten times longer than those for gas-free dead oil under similar conditions and are also a strong function of temperature and pressure, Fig. 6. The main ramification of this finding is that standard correlations to estimate viscosity from NMR data should not be applied to live oils. The NMR fluid measurements also found that the oil hydrogen index (HI) decreased with increasing temperature, Fig. 7. For a temperature decrease from 180°F to 76°F, HI dropped 20%. At pressures above the oil’s bubble point, HI is only a weak function of pressure.
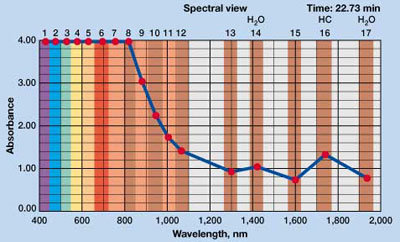
These findings compare well with recently developed models that use stock tank PVT oil properties and gas phase composition to predict gas/oil mixture HI.14 HI information has application not only for NMR logging, but also for neutron logging. Mud Logging Mud logging provides nearly real-time information concerning lithology, hydrocarbon presence, etc., for evaluation and correlation. Specialized tools can be deployed at the wellsite to expand cuttings and return mud analysis capabilities. Wellsite chemostratigraphy. Chemostratigraphy (chemical stratigraphy) is the characterization and correlation of strata from inorganic geochemical (elemental) composition. The cornerstone of this technique is the geochemical variability of otherwise apparently homogeneous sediments. Chemostrat Consultants, in alliance with Sperry-Sun Drilling Services and Westport Technology Center International, have field tested the first compact, rugged and portable spectrometer to rapidly and inexpensively determine the elemental composition of solids, slurries and liquids. The LaserStrat elemental analyzer15 has been specifically calibrated for chemostratigraphic analysis of rock samples for rapid turnaround of wellsite chemostratigraphic correlation. Wellsite applications of chemostratigraphy includes correlation while drilling through lithologically homogeneous sequences, which can help with more accurate coring point selection, geosteering and casing point selection. Another application is caving origin identification, which may provide information needed for wellbore stability analysis. Sperry-Sun will provide the LaserStrat wellsite service. Wireline Testing Formation testing provides pressure and fluid information. Optical fluid analysis. Baker Atlas’ SampleView is the latest module for their Reservoir Characterization Instrument (RCI) wireline formation tester.16 The new module generates 17-channel optical spectra (color darkness) of formation fluids brought into the tool, Fig. 8. It can distinguish oil-based mud filtrate from formation oil. During a wireline formation test when SampleView interpretation indicates that filtrate contamination is minimized, then the formation fluid coming into the RCI can be collected in a tank, providing the best chance for obtaining a representative formation fluid sample.
Test quality control. Baker Atlas’ Reservoir Characterization Instrument (RCI) uses Formation Rate Analysis (FRA),17 to analyze data quality in real time while a fluid sample is being taken. FRA is based on Darcy’s Law, which states that the pressure read by the tool must change linearly with the speed at which fluid moves in the formation. The ability to measure the parameters required for determining fluid speed in the formation was purposely incorporated into the RCI design to allow use of a straight line to verify that good data is being acquired. General Reference CD-ROMs provide formation evaluation and MWD information. SPWLA transactions. The Society of Professional Well Log Analysts (SPWLA) has added to its published Transactions of the SPWLA on CD-ROM. Volumes 21 – 30 (1980 – 1989) are available, in addition to previously published Volumes 1 – 20 (1960 – 1979), in high-resolution Adobe Acrobat PDF image file format.18 Each volume has been indexed and linked to allow rapid location and viewing of any paper. Paper abstracts have been typed into separate, text-searchable PDF files linked to corresponding papers. Each CD works with PC, Mac or Unix. Volumes 1 – 10
CD-ROM and Volumes 11 – 20 CD-ROM are each priced at $35 each and Volumes 21 – 30 CD-ROM are $40 for
single-user licenses. For information on network or corporate licensing, contact SPWLA directly
(www.spwla.org).
|
|||||||||||||||||||||||||||||||