Imaging through gas clouds with converted waves
EXPLORATIONImaging through gas clouds with converted wavesDonald field was poorly imaged, but four-component seafloor seismic data produced much better reservoir images and identified new prospectsBill Cafarelli and Eric Madtson, PGS, Houston; Jay Nahm, BP, Houston
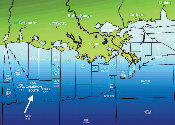
Introduction During fall 1999, PGS acquired the first commercial, multicomponent 3-D survey in the Gulf of Mexico. Undertaken on a speculative basis, portions of the survey have been licensed to several major integrated oil and gas companies. Donald field is located in shallow water, 200 mi southwest of New Orleans, Louisiana, in East Cameron Blocks 265 and 278, Fig. 1. The field contains about 20 hydrocarbon-bearing pay sands at depths ranging from 300 to 5,000 m. The reservoirs are trapped primarily within faulted anticlines, both upthrown and downthrown to a series of expansion faults. Since 1962, the field has produced roughly 400 Bcf of mainly dry gas from Middle-to-Lower Pleistocene zones.
Although initial field development was based on 2-D seismic interpretation, 47% of the total field reserves were discovered as a result of new detail made available with a 1987 3-D towed-streamer survey. However, shallow gas accumulations result in severe seismic data "wipe-out" zones and pronounced reflector sag throughout the field, Fig. 2. As a result, many known payzones are inaccurately mapped due to lack of coherent data and absence of well control.
4C Equipment Used The survey was acquired with 4C OBC, deployed without tension and not dragged. Each 4C station comprised three separate units. The unit located in the station center contained mutually orthogonal horizontal components for detecting S-waves. Two other units, located two meters on either side of center, contained vertical geophones and hydrophones for detecting P-waves. Housing the vertical and horizontal geophones in separate units eliminates any possibility of mechanical cross-feed between them, a problem sometimes observed with earlier 4C sensors. Currently, OBC systems of this type are limited to water depths of less than about 150 m. However, there are other systems available for collecting 4C data in deeper water. One of them, which evolved from borehole seismic, has worked in water depths exceeding 2,000 m. Survey Design: Patch vs. Swath Optimal choice of acquisition geometry for multicomponent surveys hinges on both geophysical and financial considerations. Invariably, tradeoffs are made. Nonetheless, for C-wave acquisition, there are many advantages to using wide-azimuth patch over narrow-azimuth swath:
On this survey, three patch designs and their associated costs were evaluated. Each was ray-traced using a velocity model obtained from previous 4C lines in the area. The Vp /Vs ratio, when plotted against depth, resembled that of a decaying exponential. This ratio ranged from about six (just below the seafloor) to less than two (at a 2-km depth). Sail-line and cable spacings were about 430 m, resulting in 110 fold in 25 x 25-m bins at a 6,000-m offset. Receiver Location, Orientation and Rotation First-break information was used to derive ocean-bottom receiver locations. Acoustic methods can also be used, but when done properly, there are usually no significant differences in either location or precision between the two methods. On this survey, ocean bottom receiver locations deviated from planned locations by < 15 m on average, with accuracy < 5 m. One might ask, "Is this good or bad?" The quick answer – perhaps true even in the case of time-lapse seismic – is that it usually does not matter how close groups come to their planned positions, provided these locations are determined with precision. During recording, C-wave energy is detected by both inline (H1) and crossline (H2) components. Since the proper azimuth for data analysis (in the isotropic case) is the source-to-receiver (radial) direction, the data must be rotated from H1 and H2 to radial and transverse components. Before doing so, the orientation of each H1 component must be determined, because when OBCs are deployed without tension, one cannot assume that the direction of inline sensors is equivalent to the receiver-line azimuth. However, in practice, this presents no difficulty; the H1 components were oriented to within an average accuracy of 3°. The majority of computed H1 orientations were within 20° of the planned receiver-line azimuth. Again, one might ask, "Is this good or bad?" Once again, the quick answer is that it really does not matter, provided H1 orientations are determined with precision. Sensor Coupling/Vector Fidelity Direct-arrival energy should be maximized in the radial direction and minimized in the transverse direction. Insight into sensor coupling and vector fidelity can be gained by comparing radial-to-transverse energy ratios. Higher ratios indicate a well-coupled sensor and high vector fidelity. In this survey, these ratios were found to be high; most of the energy rotated from H1 and H2 to radial. Ellipticity plots derived from particle motion (hodogram) analysis are also useful. The results can be quantified by comparing the ratio of minor- to- major axis. Lower ratios likely mean a well-coupled sensor and high vector fidelity. These ratios were found to be low. Data Processing Preprocessing of all components involved reformatting field data, geometry assignment, designature of the airgun-array wavelet and instrument response, and datuming. In the datuming step, shots were downward-continued to the seabed, then both shots and receivers were upward-continued to the water surface using a replacement velocity. On the P-wave data, hydrophone and vertical geophone components were combined to reduce water-column reverberations. Gain recovery, deconvolution and residual statics followed. The C-wave residual receiver statics were orders of magnitude higher than corresponding P-wave statics. This was due to slower travel paths taken by shear waves through the near surface. At this point, three different imaging routes were pursued for the P- and C-wave preprocessed data:
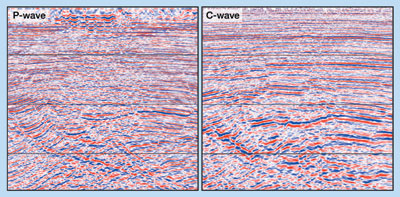
The first sequence (DMO followed by post-stack time migration) was considered a benchmark against which the other two more computationally intense and technically superior routes were compared. In all cases, velocity interpretation played a vital role. While differences between pre-stack and post-stack time migration of the P-wave volumes were small, differences between C-wave volumes were quite significant – the pre-stack time-migrated data was substantially better. Bertram Nolte took the third imaging route and further improved the C-wave data with a pre-stack depth migration that included layering anisotropy.1 While this is not commonly done today, going forward, the authors expect more C-wave data to be 3-D pre-stack depth migrated, with anisotropy (both TIV and TIH) eventually included. Discussion Fig. 3 is a P vs. C-wave comparison from the fully processed 3-D pre-stack time-migrated volume. It is a 9.5-km segment displayed from 0.0 to 3.75 sec. The C-wave section has been compressed to approximate P-wave time by using a single time-variant function. This brought corresponding P and C-wave events within 100 ms of each other. The damaging effects of a shallow gas accumulation are clearly evident in the central portion of the P-wave line, where a severe data "wipe-out" zone exists. An accurate structural interpretation cannot be made there. Gas has probably leaked up from reservoirs below; this region of Donald field is known to comprise stacked pay.
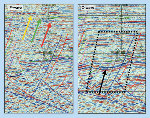
Fortunately, the corresponding C-wave section does not suffer from the same damaging effects – the mode-converted shear waves that carry the crucial reservoir images have passed through the gas cloud undisturbed, revealing the true structure. It is worth noting that the P-wave section shown is superior to the corresponding P-wave line extracted from an earlier vintage 3-D towed-streamer volume. This is believed due to wider azimuths and somewhat longer offsets (among other things) on the seafloor seismic data. Fig. 4 is an interpreted zoom of Fig. 3. In general, P and C-wave interpretations differ and must be reconciled. However, for this discussion, the P-wave interpretation was simply copied and pasted onto the C-wave section. This appears to hold up reasonably well away from the gas cloud. Where differences exist, sometimes it is due to the approximate conversion of C-wave data to P-wave time. At other times, it is due to bandwidth or reflectivity differences. Of course, there are also times when the differences are due to effects of the gas cloud on P-waves.
Several things are worth mentioning. First, look at the bright spot on the P-wave section indicated by the red arrow in Fig 4. It is a thin gas reservoir, and it does not – and should not – show up as bright on the C-wave section. Next, notice the sag (indicated by the yellow arrow) on the P-wave data due to shallow gas. That sag influenced the interpretation of a reservoir sand beneath it – the green horizon (identified by the green arrow). The C-wave interpretation of that horizon, not shown here, reveals the true structure and matches the well tops. Also, on the C-wave line, observe the key portion of data to the left of the blue fault, indicated by the parallelogram and known to be stacked pay. That area is substantially better imaged than on the P-wave data. Finally, notice the pink and blue horizons indicated by the black arrow. Here again, those two horizons have been re-mapped (although not shown) based on the C-wave data, and the new interpretation better matches the well tops. Conclusion The seismic image of Donald field was dramatically
improved with the acquisition and processing of a 4C 3-D seafloor seismic survey. C-waves illuminated
reservoirs previously obscured (to P-waves) by a shallow gas cloud. New drilling targets have been identified.
These results were achieved from seafloor seismic data acquired using orthogonal-patch geometry.
Acknowledgment The authors thank the following individuals for their contributions – Paul Krail and Brandt Temple of Texaco; Bertram Nolte of BP; and Allen Haddick, Paul Murray, Joe McNeely, Ha Nguyen, Joel Starr, Suat Altan and Xianhuai Zhu of PGS. The authors also thank BP and PGS for permission to publish this article. Literature Cited 1 Nolte, B., D. Sukup, P. Krail, B. Temple and B. Cafarelli, "Anisotropic 3-D prestack depth imaging of the Donald field with converted waves," 70th Annual International Mtg., Society of Exploration Geophysicists, Expanded Abstracts, paper MC 1.7.
|
||||||||||||||||||||||||||