|
Feb. 2001 Vol. 222 No. 2
Outlook 2001: United States
|
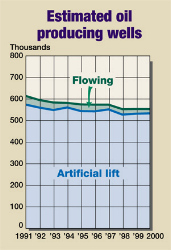
PRODUCING OIL WELLS
Stripper well losses pace decline
Changes in state counting methods and delayed response
to the big jump in crude oil prices contributed to 2000’s decline in U.S. oil wells. Time ran out in 2000
before enough wells came into production to counteract the downward spiral of recent years. Numbers from state
agencies and
World Oil estimates for unresponsive states indicate producing wells fell 2.3%, or 12,407 wells.
Texas was almost a clean sweep in declines, except for
a 0.1 % increase in District 10. Texas’ overall 5.8% decline was "helped" by a large 16.6%
decline (6,483 wells) in District 8. All other districts’ losses ranged from 0.7% to 4.7%.
The other major producing states were a mixed bag of
ups and downs, mainly downs. Oklahoma’s 2000 decline reflected a loss of another 393 wells. Although
California had a healthy increase of 6.2 % (2,494 wells), and Louisiana a miniscule increase of 1% (272
wells), states with large numbers of low-volume producers declined: Pennsylvania, down 5.9% (950 wells);
Kansas, down 1.2% (528); Ohio, down 0.2% (54); Illinois, down 20% (4,990 wells, largely due to changes in
counting methods).
The notable exception was Kentucky, with a significant
increase of 26.6% (6,160 wells), due to agency procedural changes. But even major revisions like this were not
enough to offset the declines.
If higher crude oil prices are sustained, operators
will increase drilling and look at shut-in strippers to further slow oil-well number declines. 
| |
Estimated U.S. wells producing oil at the end of 2000 |
|
| |
State or District
|
Oil Wells – 2000
|
Total
oil wells
1999
|
%
Diff.
1999 –
2000
|
|
| |
Flowing
|
Artificial
lift
|
Total
wells
|
|
| |
Alabama |
41 |
779 |
820 |
808 |
1.5 |
|
| |
Alaska |
613 |
1,239 |
1,852 |
1,824 |
1.5 |
|
| |
|
Onshore |
613 |
1,056 |
1,669 |
1,640 |
1.8 |
|
| |
|
State waters |
0 |
183 |
183 |
184 |
–
0.5 |
|
| |
Arizona |
0 |
25 |
25 |
25 |
0.0 |
|
| |
Arkansas |
68 |
7,199 |
7,267 |
7,297 |
–
0.4 |
|
| |
California** |
1,126 |
41,478 |
42,604 |
40,110 |
6.2 |
|
| |
Colorado**** |
0 |
7,000 |
7,000 |
7,500 |
–
6.7 |
|
| |
Federal OCS* |
1,713 |
1,987 |
3,700 |
3,620 |
2.2 |
|
| |
|
GOM*** |
1,713 |
1,535 |
3,248 |
3,160 |
2.8 |
|
| |
|
Pacific |
0 |
452 |
452 |
460 |
–
1.7 |
|
| |
Florida**** |
40 |
30 |
70 |
77 |
–
9.1 |
|
| |
Illinois**** |
10 |
20,000 |
20,010 |
25,000 |
–
20.0 |
|
| |
Indiana*** |
0 |
5,026 |
5,026 |
5,042 |
–
0.3 |
|
| |
Kansas**** |
0 |
43,472 |
43,472 |
44,000 |
–
1.2 |
|
| |
Kentucky |
0 |
29,300 |
29,300 |
23,140 |
26.6 |
|
| |
Louisiana**** |
2,188 |
25,762 |
27,950 |
27,678 |
1.0 |
|
| |
|
North |
835 |
20,835 |
21,670 |
21,510 |
0.7 |
|
| |
|
South |
1,190 |
4,264 |
5,454 |
5,364 |
1.7 |
|
| |
|
State waters |
163 |
663 |
826 |
804 |
2.7 |
|
| |
Michigan |
399 |
2,930 |
3,329 |
3,380 |
–
1.5 |
|
| |
Mississippi**** |
320 |
1,170 |
1,490 |
1,500 |
–
0.7 |
|
| |
Missouri |
0 |
317 |
317 |
304 |
4.3 |
|
| |
Montana**** |
463 |
2,625 |
3,088 |
3,250 |
–
5.0 |
|
| |
Nebraska |
0 |
1,170 |
1,170 |
1,160 |
0.9 |
|
| |
Nevada |
27 |
40 |
67 |
81 |
–
17.3 |
|
| |
New Mexico**** |
1,340 |
15,817 |
17,157 |
20,572 |
–
16.6 |
|
| |
|
North/West |
490 |
1,245 |
1,735 |
2,372 |
–
26.9 |
|
| |
|
South/East |
850 |
14,572 |
15,422 |
16,000 |
–
3.6 |
|
| |
New York |
0 |
3,627 |
3,627 |
3,739 |
–
3.0 |
|
| |
North Dakota**** |
190 |
2,995 |
3,185 |
3,285 |
–
3.0 |
|
| |
Ohio |
75 |
29,020 |
29,095 |
29,149 |
–
0.2 |
|
| |
Oklahoma*** |
3,000 |
81,515 |
84,515 |
84,908 |
–
0.5 |
|
| |
Pennsylvania**** |
0 |
15,050 |
15,050 |
16,000 |
–
5.9 |
|
| |
South Dakota |
0 |
160 |
160 |
129 |
24.0 |
|
| |
Tennessee**** |
0 |
625 |
625 |
700 |
–
10.7 |
|
| |
Texas*** |
7,960 |
146,144 |
154,104 |
163,600 |
–
5.8 |
|
| |
|
District 1 |
317 |
15,623 |
15,940 |
16,727 |
–
4.7 |
|
| |
|
District 2 |
224 |
1,832 |
2,056 |
2,136 |
–
3.7 |
|
| |
|
District 3**** |
1,220 |
6,957 |
8,177 |
8,500 |
–
3.8 |
|
| |
|
District 4**** |
245 |
2,045 |
2,290 |
2,390 |
–
4.2 |
|
| |
|
District 5 |
122 |
2,412 |
2,534 |
2,610 |
–
2.9 |
|
| |
|
District 6 |
670 |
8,388 |
9,058 |
9,400 |
–
3.6 |
|
| |
|
District 7B |
535 |
11,520 |
12,055 |
12,340 |
–
2.3 |
|
| |
|
District 7C |
1,020 |
10,544 |
11,564 |
11,937 |
–
3.1 |
|
| |
|
District 8 |
2,105 |
30,527 |
32,632 |
39,115 |
–
16.6 |
|
| |
|
District 8A |
428 |
21,855 |
22,283 |
22,444 |
–
0.7 |
|
| |
|
District 9 |
849 |
23,787 |
24,636 |
25,137 |
–
2.0 |
|
| |
|
District 10 |
225 |
10,654 |
10,879 |
10,864 |
0.1 |
|
| |
Utah |
95 |
1,815 |
1,910 |
1,865 |
2.4 |
|
| |
Virginia |
0 |
15 |
15 |
14 |
7.1 |
|
| |
West Virginia**** |
0 |
15,900 |
15,900 |
16,300 |
–
2.5 |
|
| |
Wyoming**** |
435 |
9,215 |
9,650 |
9,900 |
–
2.5 |
|
|
|
|
| |
Total U.S. |
20,103 |
513,447 |
533,550 |
545,957 |
–
2.3 |
|
| |
*Numbers for 2000 and 1999 reflect
lower levels than previous years due to change in MMS (OCS) counting methods, which now exclude shut-ins.
**Includes state waters
***State reported total wells, breakdown
World Oil estimate
****World Oil estimate |
|
| |
|
|
|