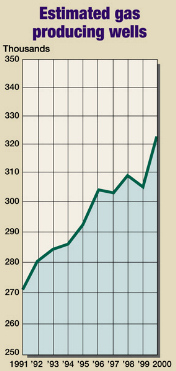
United States: Producing gas wells
PRODUCING GAS WELLSBack on the upward trendWith gas prices hitting all-time highs in 2000, it is no surprise that state agencies and World Oil estimates indicate a 2.6% (8,154-well) increase in the total number of U.S. producing gas wells. The surprise may be that the increase is not greater. But this may be due to changes in MMS/OCS’s counting method, which now excludes shut-ins, plus an agency count change in New Mexico causing a decline. What used to be flared as non-economic is now gaining increasing attention as the fuel of the new millenium.
Almost all the states with large numbers of gas wells report increases from 1999 figures. And all but one district in Texas contributed to its 4.3% (2,329-well) increase. While Texas’ District 7B had a 1.7% decrease, District 8A – a large area of gas producers in the Permian basin – more than made up for the decline with a whopping 159.6% (423-well) gain. Other increases in states with large numbers of gas wells include West Virginia, up 2% (905 wells); Pennsylvania, up 2.5% (816); Oklahoma, up1.9% (575); and Kansas and Kentucky showing increases of 3.3% (500 wells) and 4.4% (619), respectively. States showing major decreases were Ohio, 0.4% (141 wells); New Mexico, 10% (2,500 wells); and California, 6% (57). Other states that experienced gains in producing wells include Colorado, up 27.2% (2,315 wells); Indiana, up 20.2% (252 wells); Michigan, up 8.3% (500 wells); Mississippi, up 23.2% (130 wells). Coalbed methane gas wells continue to play a significant role in several states in the Rockies and elsewhere, including Colorado, Wyoming, Virginia and West Virginia. As described in Leonard Parent’s accompanying
article on the North American gas outlook, the push to increase gas reserves to fuel growing demand is
intensifying. While the past winter’s record high prices are an anomaly, the average price is expected to
be in the $4 – $5/MMBtu range, more than enough to spur drilling and prompt operators to rework stripper
gas wells all over the U.S.
|
||||||||||||||||||||||||||||||||||||||||||||||||||||||||||||||||||||||||||||||||||||||||||||||||||||||||||||||||||||||||||||||||||||||||||||||||||||||||||||||||||||||||||||||||||||||||||||||||||||||||||||||||||||||||||||||||||||||||||||||||||||||||||||||||||||||||||||||||||||||||||||||||||||||||||||||||||||||||||||||||||||||||||||||||||||||||||||||||||||||||||||||||||||||||||||||||||||||||||||||||||||||||||||||||||||||||||||||||||||||||
- Applying ultra-deep LWD resistivity technology successfully in a SAGD operation (May 2019)
- Adoption of wireless intelligent completions advances (May 2019)
- Majors double down as takeaway crunch eases (April 2019)
- What’s new in well logging and formation evaluation (April 2019)
- Qualification of a 20,000-psi subsea BOP: A collaborative approach (February 2019)
- ConocoPhillips’ Greg Leveille sees rapid trajectory of technical advancement continuing (February 2019)

