Comparative reservoir imaging using new seismic acquisition technology
EXPLORATION / EXPLOITATIONComparative reservoir imaging using new seismic-acquisition technologyA new, three-component, digital accelerometer offers improved frequency response and low noise for imaging reservoirs with shear and compressional wavesBill Goodway, PanCanadian Petroleum, Calgary; and Jon Tessman, I/O, Houston
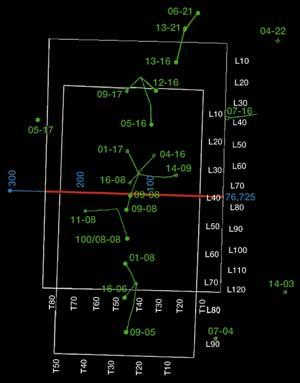
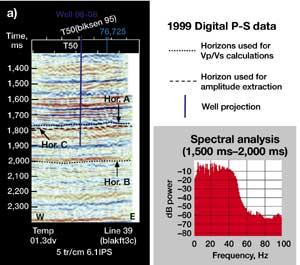
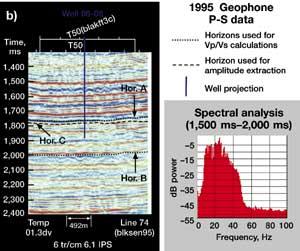
In 1999, PanCanadian volunteered the site for the first pre-commercial test of the proprietary VectorSeis sensor – a three-component, solid-state, digital accelerometer. Using proprietary acquisition techniques, a 3-D survey was carried out over a large portion of the legacy CREWES survey. Although acquisition, processing and sensor differences – as well as four years of hydrocarbon production – prevented quantitative analysis of the new accelerometer’s performance, this article evaluates several qualitative aspects. History Blackfoot field is located in south central Alberta, about 65 mi east of Calgary. The new 3-D/3C dataset was acquired over an area previously covered by a 3-D/3C survey conducted by the CREWES consortium in 1995, Fig. 1.
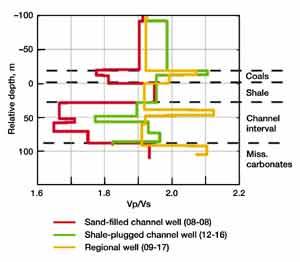
The field is a compound-incised, valley-fill system of Lower Cretaceous age. The valley system has three components: Upper Valley, Lithic Valley and Lower Valley. Of these, the Upper and Lower Valleys represent productive zones. The Lithic Valley is considered a permeability barrier between the Upper and Lower Valleys. Drainage of the paleo system is from south to north. Within the system, fluvial and distributary channel facies provide the best reservoir quality. Both regional stratigraphy and shale plugs associated with channel sequences exhibit a Vp range similar to reservoir-quality rocks. Examination of core measurements and log-crossplot data suggested that it would be possible to discriminate lithology based on Vp/Vs ratio, Fig. 2.
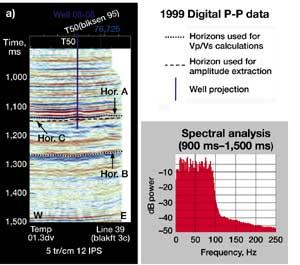
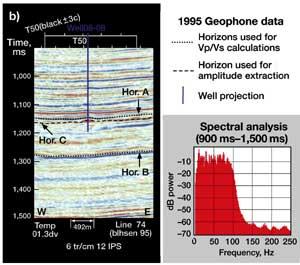
Data Acquisition The 1999 3-D/3C survey was acquired over two days in November using PanCanadian’s patented Mega-Bin technique.3 This resulted in 70-fold P-P coverage, with a natural bin size of 40 m by 80 m. Stack data was subsequently interpolated to 40 m by 40 m before migration. Converted-wave data was 30 fold, with a natural bin size of 26.5 m by 53.3 m; when binned at the P-P dimensions, this increased to about 70 fold. The 1995 CREWES 3-D/3C survey was of conventional orthogonal design that was modified to result in a fractionation bin as per Andreas Cordsen’s patented technique.4 This resulted in 33-fold P-P coverage, with a natural bin size of 30 m by 30 m. The converted wave data was subsequently binned at the same interval, resulting in 36-fold coverage. Both surveys used the same 4-kg charge size and 18-m source depth. Data Processing Both datasets were processed to "best of class" standards for their respective time frames. However, the 1999 dataset benefits from four years of development of Vp/Vs processing. PanCanadian (as well as other CREWES consortium members) is currently considering reprocessing the 1995 survey to reflect the current state of the art in converted-wave imaging. The 1999 data was left in its native acceleration mode throughout the processing sequence. Comparisons after processing, through to structural stack, indicated a residual-phase difference between velocity and acceleration datasets of only 9°. To promote 4-D interpretation of the two datasets, the statics solution from the 1995 survey was applied to the 1999 survey. This achieved satisfactory stack quality despite known long-wavelength problems. Interpretation A necessary step in validating performance of the new 3C sensor was to replicate the previously published Vp/Vs results from the 1995 CREWES survey.5 However, given the subjective (interpretive) nature of several of the previously interpreted horizons, it was decided that a more simplistic methodology would be employed. Both datasets were interpreted to create three horizons for each dataset (P-P and P-S). The horizons were chosen for their proximity to the reservoir, as well as their regional continuity. These horizons are:
These horizons resulted in two maps for both the 1999 and 1995 datasets: 1) Top Upper Valley amplitude extractions for P-P and P-S?datasets; and 2) Upper Mannville to Top Wabamun isochrons for P-P and P-S datasets. The amplitude extractions were compared to evaluate their similarity, while the isochron datasets were used to calculate Vp/Vs using the methodology prescribed by Margrave, et al.5
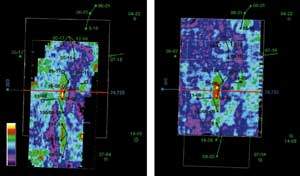
Discussion Four years of hydrocarbon production, as well as different acquisition and processing methodologies, will undoubtedly prevent quantitative conclusions as to performance of the new 3C accelerometer. However, the results do offer qualitative insight as to the performance of the sensor. Amplitudes. Both datasets result in credible amplitude extractions from the Top Upper Valley horizon. The P-P datasets show the amplitude-response characteristic of an Upper Valley channel system. These results correspond closely with historical drilling results. The new-sensor amplitudes create a narrower, more compact anomaly consistent with the depositional environment, while the 1995 results appear more diffuse. The P-S amplitude results are similar in that neither dataset produces an amplitude response associated with the channel lithology, Fig. 5.
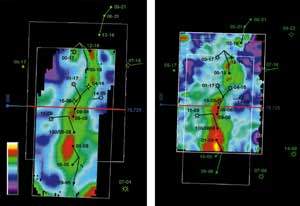
Isochrons. P-P isochron data is able to provide only limited resolution of channel location. This is primarily associated with differential compaction observed over the thickest sand sequences. While this correlates with several wells, it is not necessarily indicative of channel location or reservoir quality. P-S isochron data provide a very different view of the channel system. Both datasets show a systematic thinning of 6 – 10 ms over the channel system. This is interpreted as the shear-wave response to the presence of reservoir quality rocks. While both datasets exhibit similar results, those from the new dataset appear more continuous and less diffuse. The P-S isochron data correlate closely to the channel location as mapped from the well data, but offer little insight as to reservoir quality. Vp/Vs. Vp/Vs data calculated from both datasets produce results that correspond closely to those predicted from log data. Sands associated with the channel system are cleanly separated from regional shale formations. The best sand intervals identified from logs correspond to mapped Vp/Vs values of 1.65 to 1.80, while the regional shales correspond to mapped Vp/Vs values greater than 1.90. As was the case with the other datasets, the new data appears more continuous than the 1995 results, Fig. 6.
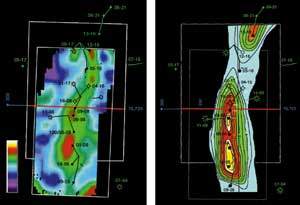
The Vp/Vs data, as mapped over this gross stratigraphic column, provide definitive indications of both channel location and reservoir quality. Similarity between the Vp/Vs maps and net-sand maps from log data are conclusive, Fig. 7.
Conclusions Seismic data acquired using the new digital accelerometer with the Mega-Bin technique is comparable to that obtained from conventional coil geophones in the 1995 CREWES survey. Further:
In general, processing of the compressional- and converted-wave datasets
showed the digital accelerometer data to be comparable to the legacy geophone data. Further amplitude and Vp/Vs
analyses confirmed these conclusions, as well as the viability of Vp/Vs
techniques as tools for identification and evaluation of compound-incised, valley-fill systems in western
Canada. Acknowledgment The authors thank PanCanadian Petroleum Ltd., and especially Dave Cooper, for their support in the testing of VectorSeis. Also, they thank the management of Input/Output, Inc. and, finally, those field personnel from both I/O and Veritas DGC Land, without whom the field test would not have been possible. Literature Cited
The authors
|