New multicomponent induction resistivity tool finds thin-bed pay
New multicomponent induction resistivity tool finds thin-bed payAdditional induction component measurements result in a more reliable and accurate low-resistivity shaly sand reservoir characterizationO. N. Fanini, B. F. Kriegshäuser, R. A. Mollison, and L. Yu, Baker Atlas, Houston; and J. van Popta, Shell Technology EP
The 3-D resistivity service, when used in combination with standard induction or LWD data, yields a more-accurate reservoir description. Shell Technology EP and the Houston Technology Center of Baker Atlas and Hughes INTEQ have jointly developed and field tested this multicomponent induction instrument. This article details the testing, theory of operation and uses of this new technology. Introduction This new instrument provides additional data – compared with traditional resistivity logging measurements – for identification and improved petrophysical evaluation. Potential impacts of this logging technology on predicting reservoir performance and evaluating project economics are significant. Exploration and production managers can now use the new 3-D service to provide additional openhole measurements that survey formation resistivity in three, orthogonal directions (3-D). This technology complements current induction-logging capabilities, which are limited to measurements in one dimension due to sensors being aligned along the tool axis. In field tests, the new tool acquired the necessary data for computation of hydrocarbon saturations. The value of the new 3-D data is demonstrated by significant improvements in reservoir characterization when determining laminar-shale volume, laminar-sand porosity and water saturation using macroscopic electrical anisotropy. Multicomponent measurements allow derivation of vertical and horizontal resistivity (Rv and Rh). This enables more-accurate petrophysical evaluation and aids in maximizing production from low-resistivity, low-contrast, shaly-sand payzones in vertical, deviated and horizontal boreholes. The results demonstrate how oil companies can economically benefit from this new technology in the course of field exploration and development. Low-Resistivity Pay Formations The 3D Explorer data and detailed petrophysical analysis can improve hydrocarbon-saturation analysis accuracy in two important types of low-resistivity pay. The first is formed by thin-bedded, laminated sand-shale sequences, Fig. 1. The second is caused by sand layers with varying grain-size distribution and/or sorting that create electrical anisotropy due to variations in water saturation, morphology of the conductive fluid and/or distribution of fluid phases.
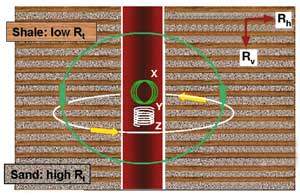
Low-resistivity pay is a common term encompassing many forms of shaly sands. Conversely, low-contrast pay implies two separate components or lithologies that are almost indistinguishable using conventional data. In this case, highly conductive shales and low-conductivity pay sands occur as thin-bedded, laminated sequences. Interbedded, thinly layered sands and shales that are below the resolution of traditional induction logging tools occur in many depositional environments. Such lithology is common in moderate- to low-energy fluvial sequences, which include upper point bar, levee and crevasse splay sands, and silty sands. Laminated shales and thin flasher-bedded shales commonly occur in subaqueous prograding deltas, tidal-estuarian deltas and shelf sands. Today, deepwater turbidites represent new-frontier exploration plays as technology allows drilling in increasingly deep waters off the mature continental shelves. Turbidites span a large spectrum of depositional-energy environments, with thin-bedded to laminar shales common to most deepwater plays. Highly productive, thin-sheet sands and silts, as well as interbedded shales of middle / outer turbidite fans typify these exploration areas. These sands are well connected hydraulically. When they occur in sufficient overall thickness, a single wellbore can drain large areas and sustain extremely high flowrates. Overbank and channel-levee sands are more erratic in thickness and shale content, but are still significant exploration targets in many basins. These sands may also be hydraulically well connected, both laterally and vertically, due to their crosscutting or cut-and-fill relationship. These intervals often produce at unexpectedly high rates from poorly developed sands at the wellbore; these are hydraulically connected to better-developed, adjacent sands. Inaccurate or overly pessimistic evaluation results will occur if traditional, empirical petrophysical-evaluation techniques are employed; these are biased by limitations of conventional resistivity measurements in thin-bedded, laminated, low-resistivity, low-contrast reservoirs. Petrophysical analysis based on empirically derived, effective-porosity models may result in underestimation of hydrocarbon reserves and production performance by as much as 40%. More-robust petrophysical-evaluation models isolate laminar-shale effects by, for example, utilizing electrical-anisotropy measurements (Rh and Rv) provided by the new 3-D data. Induction Logging Evolution Development of conventional induction tools spans several decades. The technology has evolved from simple, first-generation, transmitter-receiver arrangements to hardware-focused, induction-phase and amplitude measurements. Subsequently, investigation depth and vertical resolution were improved by choosing interconnected arrays of transmitter and receiver induction coils. During the last 20 years, arrays of transmitter-receiver induction coils performed measurements at multiple frequencies and spacings, providing enhanced vertical resolution and more detailed resistivity profiles. However, with sensors aligned along the borehole axis, these array induction measurements are limited to measurements in one dimension. Such measurements are typically satisfactory for evaluating sand payzones at least a few feet thick. The new, multicomponent induction tool, with its three orthogonal-mounted coil arrays, allows evaluation of much thinner lithologies. Basic Operating Concept Many geologic formations exhibit resistivity anisotropy, i.e., resistivity varies with direction. In exploration wells which are often drilled vertically or close to vertical, hydrocarbon-bearing sand-shale formations are often overlooked or underestimated due to low-resistivity shale and resulting low formation-resistivity measurements from conventional logs. To overcome this problem, the multicomponent induction tool collects additional data, Fig. 2.
Conventional, openhole induction-logging tools comprise transmitter and receiver sensors with their axes aligned parallel to the borehole axis. If apparent formation dip is small, conventional tools induce currents in the adjacent formation that flow mainly parallel to the bedding planes and, by their nature, mostly in conductive intervals or beds – typically, the shale – thus measuring horizontal resistivity of the formation. This induced-current flow pattern, so-called horizontal resistivity, is heavily biased toward low-resistivity shale and is insensitive to hydrocarbon-bearing sand resistivity. Horizontally mounted coil arrays in the 3DEX tool are instead aligned with their axes perpendicular to the borehole to better resolve vertical resistivity. These arrays induce currents that flow mostly across laminated sand-shale sequences and are far more sensitive to hydrocarbon-bearing sand resistivity, Fig. 2. Vertical and horizontal resistivity values are obtained by processing measurements from multicomponent coil arrays. Electrical Anisotropy Effect In a thinly laminated sand-shale sequence, effective horizontal and vertical resistivities can be derived using parallel and series resistor models. The corresponding formulae are:
and
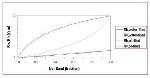
Rsh and Rsd denote shale and sand resistivity, respectively, and Vsh and Vsd are the corresponding shale and sand volume fractions, i.e., Vsh + Vsd = 1. Equation 1 explains the strong dependence of Rh on shale resistivity (usually low) and shale volume, and the poor sensitivity of Rh to sand resistivity. Small amounts of shale can significantly suppress horizontal-resistivity readings. Conventional induction tools that log perpendicular to formation bedding will only be sensitive to horizontal resistivity (Eq. 1). Vertical resistivity (Eq. 2), however, averages contributions from both sand and shale and, therefore, is a much better indicator of thin hydrocarbon-bearing sands. Pore-Fluid Measurement Sensitivity Fig. 3 depicts horizontal and vertical resistivities for a finely laminated sand-shale sequence in which the sands can be water or oil filled. Note that for both horizontal and vertical resistivities, effective resistivities are averaged over a layer package, with thickness equal to the tool resolution of about a meter. For example, in a 50% net-to-gross (i.e., 50% laminar shale) case with shale and sand resistivities of 1 and 10 ohm-m, respectively, the horizontal resistivity is suppressed to 1.8 ohm-m, while the vertical measurement reads 5.5 ohm-m, Fig. 3. When petrophysical analysis employs models using conventional horizontal resistivity, potentially productive sand-shale sequences can be difficult to identify.
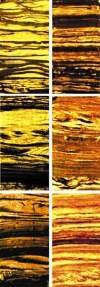
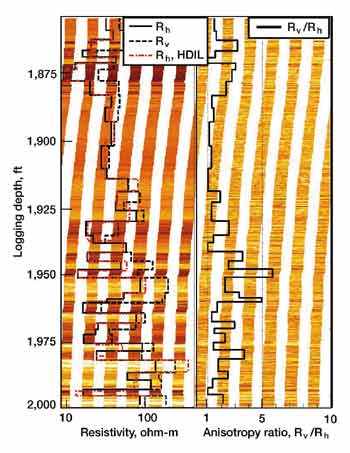
The important feature in Fig. 3 is the small difference in Rh – provided by a standard induction-resistivity log – between the laminated sand-shale sequence containing hydrocarbon- or water-filled sands. However,Rv is very sensitive to sand pore-fluid content. Sensitivity remains high even when the sand fraction is as low as 20%. Therefore, vertical and horizontal resistivity data are very useful for accurately evaluating hydrocarbon saturation in thin-bedded, sand-shale sequences. Processed Resistivity / Borehole Image Data To illustrate multicomponent induction data, high-resolution, borehole electrical-image data was also acquired with the Simultaneous Acoustic and Resistivity Imager (STAR) tool in a test well. STAR’s typical spatial-sampling rate is ten per inch, thus giving a high-resolution resistivity image of the formation. The left and right panels in Fig. 4 show the tool’s borehole-image data on static and equalized scales, respectively; dark shades pertain to conductive layers, while light shades correspond to more-resistive layers.
Overlaid on the left image are horizontal and vertical formation resistivities obtained from multicomponent-induction measurements and the inverted horizontal resistivities from a conventional High Definition Induction Logging Tool (HDIL). In the right image, the ratio of vertical to horizontal resistivity is superimposed on the borehole image data. There is good correlation between the image and horizontal resistivities from HDIL and multicomponent induction tools. The anisotropy ratio, i.e., the ratio of Rv to Rh, correlates well with thin-layering features visible in the borehole image. Low-Resistivity Pay Example Archie’s water-saturation equation, published in 1942, established the cornerstone for petrophysical interpretation. This equation is suitable for thick, shale-free, hydrocarbon-producing sand reservoirs. Higher formation-resistivity measurements relate to higher hydrocarbon saturation within the rock pore space. Today, petrophysicists are confronted with increasingly complex reservoir evaluation and production challenges. Numerous traditional, shaly-sand petrophysical models exist today, many of which are empirical derivatives of Archie’s equation. This has contributed to inconsistency and uncertainty in applying these models to complex reservoir-evaluation problems encountered in low-resistivity, low-contrast pay formations. Therefore, these formation-evaluation models are not always acceptable for marginal or costly development decisions, such as in deep water. Using Rh and Rv in the proper formation-evaluation model provided with this new service results in improved reservoir characterization of laminar-sand porosity and water saturation. By taking advantage of macroscopic electrical anisotropy derived from the new induction instrument, the saturation-evaluation model accurately quantifies both laminar and dispersed-shale effects when they occur in combination. Petrophysical analysis results – using data from a 3DEX field log in a typical shaly-sand depositional environment – are shown in Fig. 5. Such zones are moderate to high in both laminar-shale volume and net-to-gross pay. These results demonstrate the advantages of including electrical anisotropy in the analysis.
The log example (Fig. 5) has three sand intervals with different ranges of both electrical anisotropy and shale content. The middle sand (145–169 ft) is gas producing with low shale content, which can be properly identified and evaluated with conventional data. The upper sand (100–145 ft) has moderate shale content and electrical-anisotropy range, both of which can be identified by conventional log data. The Rv and Rh data improve evaluation accuracy for the upper sand. The lower sand (169–220 ft) has higher shale content and higher electrical anisotropy than the upper sand. Conventional, deep-induction resistivity data (HDIL), shown in Track 2, cannot effectively identify this interval as a potentially productive, sand-shale sequence. The Rv and Rh data improve evaluation accuracy of the lower sand and properly identify this as a finely laminated sand interval. The "fining-upward sequence" of moderately shaly sand in the upper interval, from 100 to 145 ft, shows significant anisotropy (Track 1), as demonstrated by the separation of Rv and Rh (Track 2). Petrophysical analysis reveals that the shales are predominately laminar with some dispersed shale present (Track 4), and that the calculated laminar-sand resistivity, Rsd, is 3 to 5 Ohm-m higher than shown by 3DEX or conventional deep-induction Rh (Track 2). Water saturation from the laminar-sand analysis is 10–15% lower than that from standard saturation analysis (Track 3); it indicates probable commercial hydrocarbon-production rates from the interval. The middle sand interval, from 145 to 169 ft, exhibits little anisotropy, as would be expected in a massive, high-porosity sand. Both Rv and Rh from the new 3-D tool agree well with the deep-induction resistivity (HDIL) and hydrocarbon saturation, indicating that this is excellent pay sand which should produce at high rates. The lower sand interval, from 169 to 220 ft, is the most interesting in this well. Typical shale-resistivity anisotropy values measured in this well were included in this analysis. Total shale volume is 60% to 70%; however, Rh and Rv curve separation, together with the resulting anisotropy ratio, indicate that the formation is almost entirely laminar and thin bedded, as shown in previous core photos, and that average net / gross pay ratio is 35%. The laminar-sand analysis for water saturation yields 40% to 55% and agrees well with water saturation in the upper sand interval. The result is about 18 ft of additional net pay that may not have been included if based on standard water-saturation (>70%) analysis. Interpretation of 3DEX field measurements in shaly zones indicates that using Rh and Rv – resulting from macroscopic anisotropy and direct evaluation of laminar-sand-fraction resistivity (Rsd) – makes identification and quantification of low-resistivity contrast, low net-to-gross pay more reliable. Results of a separate test in another field supported significantly increasing OOIP estimates and field redevelopment. Conclusion A new multicomponent induction-logging instrument has been successfully
designed, built and field-tested. Several field tests confirm its capability to highlight and resolve
low-resistivity, electrically anisotropic, laminated sand-shale sequences with potential hydrocarbon
productivity. Novel petrophysical-interpretation procedures combine the new measurements with conventional log
data and make more-accurate reservoir description possible. This new technology will have significant economic
impact when utilized in reservoir appraisals of exploration wells and field developments.
Acknowledgment The authors thank Shell Technology EP, as joint developers, for their sponsorship and continuing support of this project. Thanks also to the various Shell operating groups for permission to publish the logging data and examples. 3DEX, 3D EXPLORER, HDIL and STAR are trademark names owned by Baker Hughes International. The authorsOtto Fanini earned an MSc in electrical engineering from Texas A&M University in 1982. He worked in the semiconductor industry from 1982 to 1986, in broadcast and communications from 1986 to 1990, and in instrumentation equipment from 1990 to 1992. He joined Baker Atlas in 1992 where he develops microresistivity, galvanic and induction-resistivity logging instruments. He is a member of IEEE and SPE. Berthold Kriegshäuser has worked as a research scientist for Baker Atlas since 1994. His primary responsibilities include design of electromagnetic logging instruments and development of interpretation and inversion techniques for wireline data. He earned his MSc in geophysics from the University of Cologne, Germany, in 1992 and his PhD in geophysics from the University of Utah in 1997. Before joining Baker Atlas, he worked as a consultant for various geophysical companies in Germany and the U.S. He is a member of SEG, SPE and EAGE. Richard Mollison earned a BS in geology from University of Oklahoma in 1976 and an MS in geology from the University of Arkansas in 1979. He worked for Exxon Production from 1979 through 1982. From 1982 through 1996, he worked for BHP Petroleum in production, exploration and operations geology as a petrophysicist. From 1996 to 1998, he worked for NSAI as a consulting petrophysicist. He is currently a Baker Atlas staff scientist conducting petrophysical and interpretation R&D support for new technology. Liming Yu earned an MS in geophysics from the China University of Geosciences, PR China, in 1982, and a PhD in 1994 in geophysics from the University of Toronto, Canada. From 1982 to 1989, he was an assistant professor at the China University of Geosciences. He worked at Ecole Polytechnique of Montreal as a research associate before joined Western Atlas Logging Services in 1997, where he currently works as a senior scientist. His interests are electromagnetic modeling and inversion, induction logging data processing and interpretation. He is a member of SEG. Johan van Popta earned an MSc in Physics from the University of Gronigen in 1977. In 1979, he joined Shell as a research petrophysicist, working in a multi-disciplinary team for interpreting seismic using well data. From 1982 to 1988, he did operational petrophysics and multi-disciplinary field studies in two Shell operating companies. Since 1989, he has worked in Shell Technology EP, where his involvement has been with acoustic, gravity and resistivity tool development and interpretation, and in reservoir monitoring. |
- Applying ultra-deep LWD resistivity technology successfully in a SAGD operation (May 2019)
- Adoption of wireless intelligent completions advances (May 2019)
- Majors double down as takeaway crunch eases (April 2019)
- What’s new in well logging and formation evaluation (April 2019)
- Qualification of a 20,000-psi subsea BOP: A collaborative approach (February 2019)
- ConocoPhillips’ Greg Leveille sees rapid trajectory of technical advancement continuing (February 2019)

